
What's Behind the Name? A Company Checklist With the Evidence for Every Answer
Updated on 29 Sep 2026, 12:00

You've heard a company's name: from a friend, in a news story, in a fund you already own. Before you decide what you think of it, there's a simpler question worth answering first: what's actually behind the name?
The company answers much of that question itself. US companies file an annual report with the SEC, the Form 10-K, and the SEC describes it as offering "a detailed picture of a company's business, the risks it faces, and the operating and financial results for the fiscal year." The trouble is reading it. It's long, it's written for regulators as much as for people, and it doesn't tell you which parts matter.
That's the gap the Compounder Score is built for.
A checklist, not a verdict
The Compounder Score checks a company against 22 points, grouped in five phases. Each phase asks one plain question:
- Moat: How durable is this company's competitive advantage? Pricing power, barriers to entry, network effects, brand strength and switching costs, read from the filing's own words.
- Management: Does management deserve your trust? Ownership alignment, capital discipline, candor about setbacks and leadership tenure.
- Financial Health: Is the balance sheet and cash generation actually strong? Returns on capital, cash conversion, debt, margins and inventory discipline.
- Valuation: Is the current price a fair one to pay? Margin of safety against a DCF estimate, business predictability, growth-adjusted valuation, and earnings yield against US Treasuries.
- Risk: What could go wrong? Disruption, regulatory threats, customer concentration and share dilution.
The name comes from the kind of business the checklist was designed around: one that can keep reinvesting its profits at good returns, year after year. Each point is scored from 1 to 10, and the phases combine into an overall score.
A score describes how a company measures up against this checklist. It isn't a forecast of the share price, and it isn't a recommendation to buy or sell anything. You decide what it means for you.
Every answer shows its evidence
A checklist is only as useful as your ability to check it. So every one of the 22 points shows you where its answer came from.
The algorithmic checks show their figures. Some points are pure arithmetic on the company's financial statements. Debt Load, for example, compares the company's latest total liabilities with its latest annual free cash flow. For every point like this, you see the figures the rule read and the scale it was scored against, so you can redo the calculation yourself.
The AI-augmented checks quote the filing. Other points need reading, not arithmetic: whether a company talks openly about its setbacks, or whether its customers would find it hard to switch. For these, an AI model reads the company's SEC filings and returns an answer with a verbatim quote from the filing. Before that answer is shown, the quote is checked against the filing it claims to come from. A quote that can't be found there is not shown at all. Each quote links to the filing on SEC EDGAR, so you can read the sentence in context.
Missing data stays missing. When an input isn't available (a figure missing from the statements, a section that couldn't be isolated in the filing), the point says so in words and is left out of the score. It is never filled in with an estimate.
What it looks like on an example
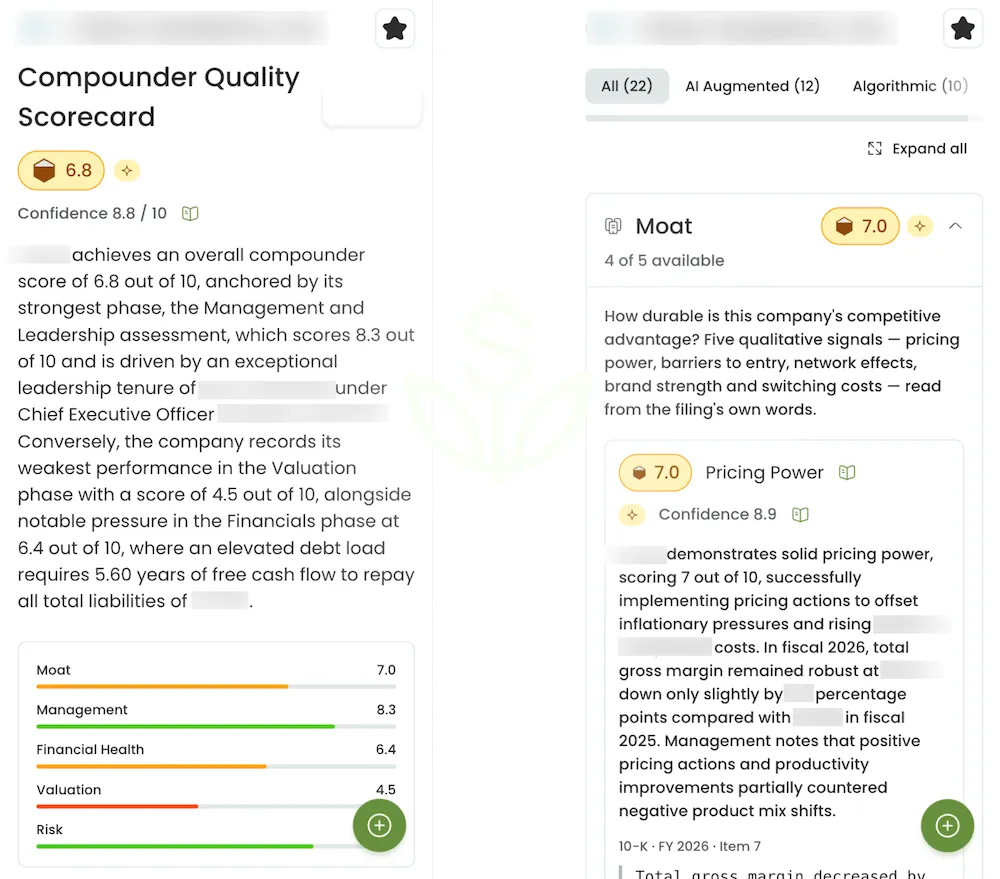
Illustrative. Screens from Value Sages with the company's identity hidden. No company is named or recommended in this post.
Picture a company you're curious about, and open its page in Value Sages:
- The score card sits in the row of analyses at the top of the page: the overall score, and how confident the analysis is overall, on a scale of 10.
- "View full scorecard" takes you to the five phases. Open one, and each point shows its score, whether it is algorithmic or AI-augmented, and its confidence.
- Open a point to read a plain-English explanation, then "How this was scored" for the figures and the scale, or "Traceable Sources" for the filing quote and its link.
The price-based valuation checks are refreshed each day, after the day's market data arrives, so they don't go stale while the rest of the analysis waits for the next filing.
Where it fits in your process
In the S.A.G.E. journey, the Compounder Score belongs to Analyze Fundamentals: the step where you test what you've found before it goes anywhere near your portfolio.
- After you screen. The screener, your watchlists and your portfolio holdings all carry a Quality column. A company that hasn't been scored yet shows "+ Score", which takes you to its page to run the analysis.
- Beside your valuation. The checklist asks whether a business is worth owning. The glass-box DCF asks what it might be worth, on your assumptions, starting from a sensible default. The two answer different questions, and they sit side by side on the same page.
What you need to know before you start
- US-listed companies only, for now. The AI-augmented checks read SEC filings, which only companies that report to the SEC publish. For a company whose listing exchange isn't in the US, Value Sages says the score isn't available rather than showing a partial one.
- What each plan shows. On the Free plan you see every algorithmic check, including all five Financial Health checks. The Pro plan adds the AI-augmented checks, the overall score and the written summary. The demo shows the Free plan's view on a set of demo companies. Plans and terms are on the pricing page.
- The first run takes a few minutes. The first time anyone requests a company, the analysis reads its filings. After that, the result is ready for every user.
- AI is part of the analysis, and it's labelled. Every AI-augmented point says so, carries a confidence figure, and shows the quote it rests on. If a quote or a figure looks wrong, you can report it from the scorecard.
References: U.S. Securities and Exchange Commission: How to Read a 10-K (modified 2011-07-01)

Analyze companies with transparency, confidence, and full control.
Try Value Sages Free Disclaimer - No Investment Advice
The content provided on this Website is for educational and informational purposes only. It does not constitute financial, investment, or legal advice. Users should conduct their own research and/or consult professional advisors before making any investment decisions. SAGES LTD is not responsible for any financial losses incurred based on the information provided.


