
Know What You Own: A Portfolio Built From Your Own Trades
Updated on 30 Sep 2026, 12:00

Your broker app tells you what your shares are worth today. It's good at that. What it's less good at are the questions that come after: what have I actually made, counting everything I put in and took out? What have my dividends added up to? And what do I think each of these companies is worth?
The Value Sages Portfolio answers those from the one record you already have: your own trades.
Built from your trades, not from a guess
You record the buys and sells you've made: the stock, the date, how many shares, the price, any commission, and the currency you paid in. You can add a note to each, too.
Everything else is worked out from that record every time you open the page: how many shares you hold, your average cost, your cost basis, what the position is worth now, its share of your portfolio, and your total return. Nothing is stored separately and nothing is estimated. Correct a trade, and every figure follows.
Each portfolio reports in a currency you choose. What you paid is converted at the rate on the day of the trade, and what it's worth now at today's rate, so a currency move shows up in your return instead of disappearing.
How the return is worked out, on an example
An illustrative example, with no real company behind it. One stock, bought twice and partly sold. The price today is 200.
| Date | Trade | Shares | Price | Commission |
|---|---|---|---|---|
| 15 Jan 2024 | Buy | 10 | 100 | 5 |
| 10 Jun 2024 | Buy | 10 | 150 | 5 |
| 5 Dec 2024 | Sell | 10 | 180 | 5 |
- Total invested: everything you paid for your buys, commissions included: 1,005 + 1,505 = 2,510.
- Sale proceeds: 1,800 less the 5 commission = 1,795.
- Market value today: the 10 shares you still hold, at 200 = 2,000.
- Total return: what you hold, plus what you sold, less what you paid: 2,000 + 1,795 − 2,510 = 1,285, or 51.2% of the 2,510 you put in.
Two figures look similar and answer different questions. Your average cost is 2,510 divided by the 20 shares you bought, 125.50 a share, and the cost basis of the 10 you still hold is 1,255. Your return is measured against the 2,510 you invested in total, not against that 1,255. The Portfolio says so beside the figure, because mixing the two is the easiest mistake to make.
The total return is one merged figure. It doesn't split realised from unrealised gains, and the average cost is a way of presenting the figures, not a tax method.
What it keeps track of for you
- Stock splits. When a company splits its shares, the Portfolio restates your quantity to today's share count, so ten shares bought before a 2-for-1 split show as twenty. The holding says "Adjusted quantity" and names the split that changed it. The trade you recorded is never changed.
- Dividends. The Portfolio counts the gross dividends each holding has paid you, from the shares your trades show you held on each payment's ex-dividend date. Each payment is converted at the rate on the day it was paid. You see the total per holding and for the whole portfolio, and every payment in the holding's Dividends tab. A stock that has paid nothing shows "--", not 0.00. Dividends are shown beside your total return, not inside it.
- Value over time. A chart of your portfolio's value, rebuilt from your trades. Because it's rebuilt rather than recorded day by day, it goes back to your first recorded trade, not to the day you created the portfolio. Buys and sells are marked on the line, so a jump that comes from money you added isn't mistaken for a gain.
Your own valuation, beside every holding
With the Pro plan, each holding shows the fair value from your own primary DCF analysis of that stock, and the margin of safety it implies. It's the output of your model, run on your assumptions, not a forecast or a price target. Every analysis starts from a sensible default you can change. If you have analyses but none is your default, the holding asks you to pick one rather than create another.
For US-listed stocks, the holdings table also carries the Compounder Score's Quality column.
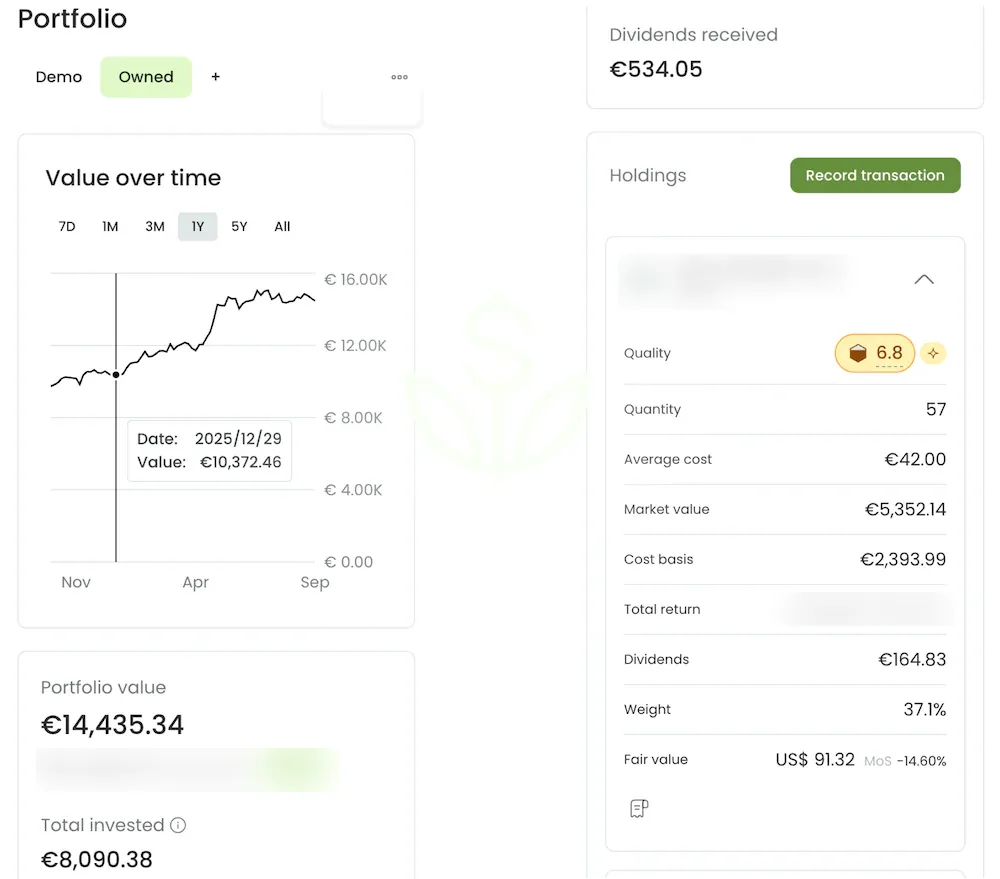
Illustrative. A Value Sages portfolio with the company's identity and the return figures hidden, captured 30 September 2026. No company is named or recommended in this post.
Where it fits in your process
In the S.A.G.E. journey, the Portfolio belongs to Govern your Portfolio: the step where you record what you own and keep checking it against your own analysis, calmly and on your own schedule.
Nothing links to a broker, so you can also record trades you're only considering, not only the ones you've made, and follow them the same way.
What you need to know before you start
- Stocks only, for now. You can record individual stocks, not ETFs or funds. If you hold a fund as well, the Portfolio won't include it, so its totals won't be your whole picture.
- What each plan includes. The Free plan includes 1 portfolio, with up to 5 holdings and 6 transactions per holding. The Pro plan removes the limits on portfolios, holdings and transactions, and adds fair value beside each holding. Plans and terms are on the pricing page.
- The demo is temporary. A demo account, and any portfolio recorded in it, is deleted once it is more than a day old. Create a free account to keep yours.
- Dividends are gross. They're shown before any withholding tax, which depends on your broker and your country.
- It's only as complete as your record. The figures come from the trades you enter, and nothing is imported from a broker.

Analyze companies with transparency, confidence, and full control.
Try Value Sages Free Disclaimer - No Investment Advice
The content provided on this Website is for educational and informational purposes only. It does not constitute financial, investment, or legal advice. Users should conduct their own research and/or consult professional advisors before making any investment decisions. SAGES LTD is not responsible for any financial losses incurred based on the information provided.


