
What Would a Plain Monthly Plan in the Index Have Done?
Updated on 01 Oct 2026, 18:05

When you review your own investments, one question keeps coming back: compared with what? A plain alternative is the one most people have heard of. Put the same amount into an index fund every month, and leave it alone.
The Value Sages benchmark calculator replays exactly that plan on real historical prices, so you can see what it would have done over a period you choose, and check every step of the arithmetic. It shows history. It doesn't forecast anything.
What the calculator replays
One instrument, the same for everyone: SXR8.DE, the iShares Core S&P 500 UCITS ETF, as traded on Xetra in euros. It tracks the S&P 500 index of large US companies. It's an accumulating share class, so it pays out no distributions, and the replay has none to handle. You can't swap in another fund, and that's deliberate. A fixed benchmark means everyone's replay runs against the same instrument.
You set five things: an initial amount, a monthly amount, a start date, an end date and a currency. Then the replay follows three rules:
- When money arrives. Your initial amount is there on the start date. Each monthly amount arrives on the 1st of every month after it.
- When it's invested. All the cash waiting is invested on the next trading day, at that day's closing price. Units are fractional, so nothing is left over.
- What's never done. Nothing is ever sold, and no transaction costs or taxes are taken off.
A real replay, over three periods
Facts, not a forecast. The figures below are what the calculator produced on real historical prices. They describe the past only. They are not a projection, a guarantee or an indication of what a plan started today would do.
The same plan over three periods ending on the same date: €100 up front, then €100 on the 1st of every month, in euros. Three periods, rather than one, because any single start date can flatter or punish a plan.
| Period replayed | Contributed | Outcome | Difference |
|---|---|---|---|
| 1 year: 30 Sep 2025 → 30 Sep 2026 | €1,300.00 | €1,466.55 | +€166.55 (+12.81%) |
| 5 years: 30 Sep 2021 → 30 Sep 2026 | €6,100.00 | €9,261.67 | +€3,161.67 (+51.83%) |
| 10 years: 30 Sep 2016 → 30 Sep 2026 | €12,100.00 | €27,375.86 | +€15,275.86 (+126.25%) |
Computed on 1 October 2026, between 17:47 and 18:02 UTC, with the Value Sages benchmark calculator, for an end date of 1 October 2026. There was no price for that day, so each replay ends at the last close before it, 30 September 2026. Price data from Financial Modeling Prep, as stored by Value Sages. Before any costs or taxes.
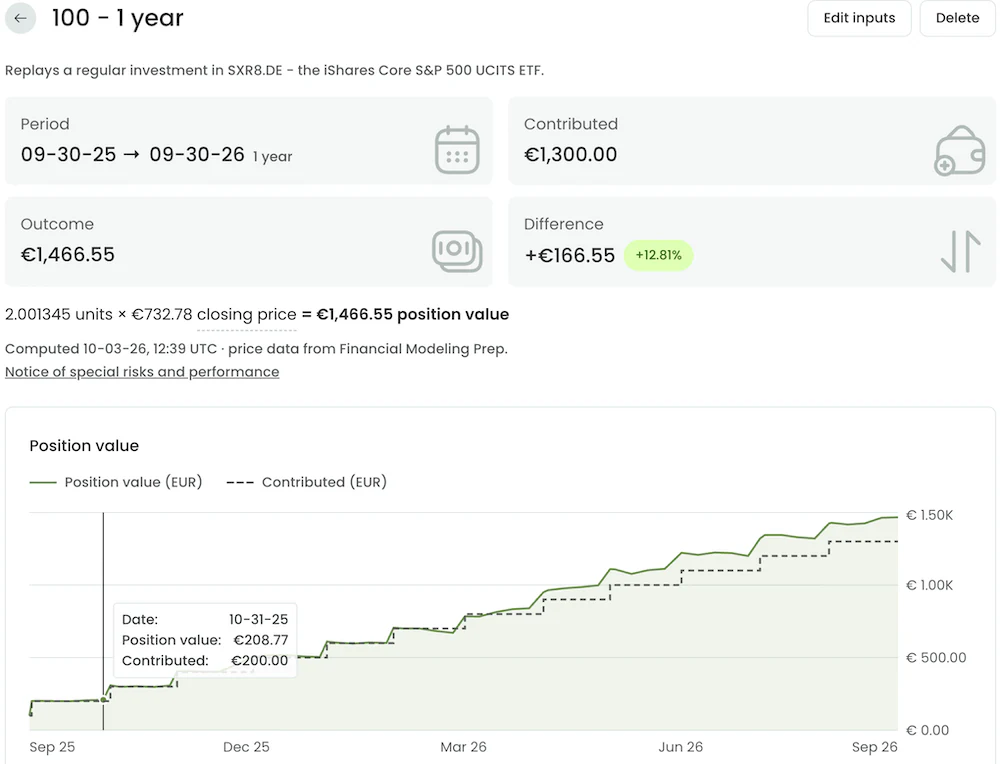
A real replay: €100 up front and €100 a month into SXR8.DE, 30 September 2025 to 30 September 2026, computed 3 October 2026, 12:39 UTC. History, not a forecast.
The end isn't the whole story. The value chart draws what the plan was worth against what had gone in, and the end point hides how it got there:
- 1 year: by its 1 April 2026 purchase, the plan was worth €784.59 against €800.00 put in.
- 5 years: it spent stretches of 2022 below what had gone in. By its 3 October 2022 purchase, it was worth €1,340.66 against €1,400.00 put in.
- 10 years: on a purchase date, it was below only in its first months (€297.96 against €300.00 in November 2016). By 2022, the gains of the years before kept it well above, and the same fall that took the 5-year plan under didn't take it under.
The same prices give different paths depending on when a plan starts. That's the reason for showing three periods.
Checking the outcome yourself. The calculator shows the sum behind the outcome. For the 10-year row: 37.358912 units × €732.78 closing price = €27,375.86. That's the outcome, because every euro that arrived was invested. The purchases table lists all 121 purchases, each with its date, the cash in, the price, the units bought and the units held.
Value Sages has no paid, partner or affiliate relationship with the fund's issuer or the exchange, and its team holds no position in the fund.
What the replay helps you see
- A baseline for your own plan. When you review what you hold, "what would a plain index plan have done?" gives your numbers a reference point that doesn't depend on anyone's opinion.
- The path as well as the end. The value chart draws what the plan was worth against what had gone in, over the whole period. The price chart below it draws the ETF's own closing price, with a marker for every purchase.
- Every step, checkable. Each purchase, and the sum behind the outcome, is on the screen. Nothing is summarised away.
In the S.A.G.E. journey this belongs to Evolve your Wisdom: learning from history what a strategy has meant over time, before you judge your own.
What you need to know before you start
- One fixed instrument. The replay always uses SXR8.DE. It isn't a comparison with your own holdings, and it can't replay a strategy of your own.
- History, not a forecast. A replay describes what prices did. It says nothing about what they will do.
- Its price is in euros; what it holds is in dollars. The fund's base currency is the US dollar and it holds US shares, so its euro price also moves with the exchange rate.
- What each plan replays. Every account can use it. On the Free plan, and on a demo, the replay covers the last three years. The Pro plan replays the ETF's full stored history. Plans and terms are on the pricing page.
- Saved, and recalculated. Every calculation is saved, so you can reopen, edit or delete it. Reopening recalculates on the prices stored at that moment. A demo can hold 3 saved backtests, and a demo account is deleted once it is more than a day old.
- Other currencies. You can replay in another currency. Each purchase and valuation then uses that day's exchange rate, and the rate is shown. If a rate for a date is missing, the calculation stops and says which date, rather than guessing one.
- Before costs and taxes. No fees, spreads or taxes are modelled.

Analyze companies with transparency, confidence, and full control.
Try Value Sages Free Disclaimer - No Investment Advice
The content provided on this Website is for educational and informational purposes only. It does not constitute financial, investment, or legal advice. Users should conduct their own research and/or consult professional advisors before making any investment decisions. SAGES LTD is not responsible for any financial losses incurred based on the information provided.


